We see far greater risk of massive irreversible sea level rise (SLR) at 2°C, on a scale of 12–20 meters or more in the long term. The climate record of the Earth over the pat few million years is quite clear:
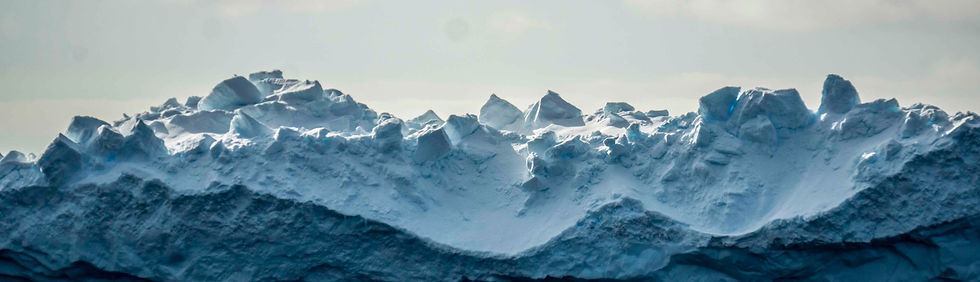
Sea Level Rise from Ice Sheets
We see far greater risk of massive irreversible sea level rise (SLR) at 2°C, on a scale of 12–20 meters or more in the long term. The climate record of the Earth over the pat few million years is quite clear:
Sea Level Rise from Ice Sheets
Sea Level Rise from Ice Sheets
We see far greater risk of massive irreversible sea level rise (SLR) at 2°C,
on a scale of 12–20 m or more in the long term.
The climate record of the Earth over the past few million years is quite clear:
• At today’s temperature of 1°C over pre-industrial, we have locked in about 1–3 meters of sea-level rise over the next centuries from loss of mountain glaciers and a portion of the polar ice sheets, even if we could hold temperatures at 1°C.
• Risks rise substantially at 1.5°, with the Earth showing a pattern of 6–9 meters compared to today when it was this warm in the past; coming from additional loss of Greenland and most of the West Antarctic Ice Sheet (WAIS).
• 2°C however shows a much sharper rise: between 12–20 meters as the new global sea level, locked in over millennia. This is because both the WAIS and Greenland melt nearly completely at a sustained 2°C; with vulnerable portions of East Antarctica also posing a threat; and up to 25 meters occurring between 2° and 3°C.
• Most seriously, periods of time well in excess of 2°C – especially if we reach 3°C, 4°C or more, which is our current emissions pathway – increase the risk, speed and potential inevitability of the above changes. The rate of change can itself become a risk: at the end of the last Ice Age, sea levels rose by up to 4 cm per year, and 12–14 meters in the space of a few centuries.
The good news: these processes, especially the collapse of the West Antarctic Ice Sheet can be slowed if temperatures remain close to 1.5°, allowing far more time for communities to adapt to the rising seas. Much of the WAIS may have passed a threshold of collapse sometime between 2010 and 2015, at around 0.8°C; but at lower temperatures such as 1.5°C, this collapse can be slowed to perhaps thousands of years, rather than (in the worst projections) just a few centuries. Even at today’s 1°C, Greenland’s ice loss has doubled in the past 20 years; and Antarctica’s has tripled.
Scientific Editors
Julie Brigham-Grete, University of Massachusetts-Amherst
Robert DeConto, IPCC SROCC LA, University of Massachusetts-Amherst
Scientific Reviewers
Richard B. Alley, Pennsylvania State University, IPCC AR4 Lead Author
Jonathan Bamber, University of Bristol, IPCC AR5 Review Editor
Carlota Escutia, Spanish Research Council and University of Granada
Michael Schaeffer, IPCC AR5 LA, Climate Analytics
Roderik van de Wal, IPCC SROCC LA, University of Utrecht
Background
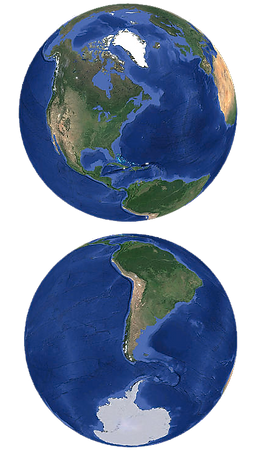
The massive ice sheets of Greenland and Antarctica consist of compressed snow that fell, in its oldest sections, up to a million or more years ago. In equilibrium, calving of icebergs and outflow of melt water into the ocean balance the snowfall adding mass to the ice sheets. Observations now confirm that this equilibrium has been lost on Greenland, the West Antarctic Ice Sheet (WAIS) and Antarctic Peninsula; and key portions of East Antarctica.

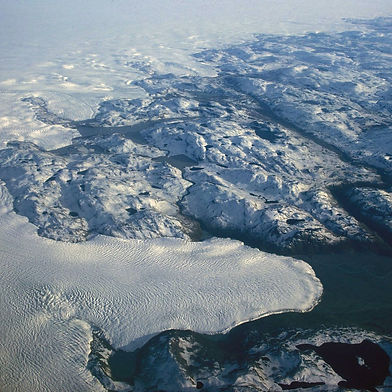
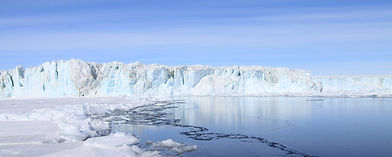
Aerial of Browning Peninsula Casey, Antarctica.
Global Risks from Ice Sheet Loss
Any change in the total mass of land ice bound within the land-based ice sheets of our planet has direct consequences for global sea level. During ice-age periods, when the ice sheets expanded significantly, sea level was more than 100 meters lower than today. During periods of warming, when the ice sheets lost mass, sea level rose accordingly.
In addition, the topography of the ice sheets strongly influences atmospheric circulation at high latitudes. Changes in the height and extent of the ice sheets, together with incursion of new cold water into ocean currents from ice sheet melt, are reflected by changes in Earth’s weather patterns not only near the poles, but at lower latitudes.
Ice Sheet Thresholds
The Greenland ice sheet and parts of the Antarctic ice sheet have discrete thresholds where melt becomes inevitable, and (in the case of the West Antarctic Ice Sheet) potentially relatively rapid.
In Earth’s past, several of these thresholds (driven by slow Earth’s orbital changes) have occurred somewhere between 1 and 2°C: about 1° for the WAIS and Antarctic Peninsula (3–5 m SLR); and between 1.5° and 2° for Greenland (7 m SLR).
Parts of East Antarctica, especially the massive Wilkes Basin (4 m of potential SLR), may also have a threshold around or just beyond 2°.
This combination likely explains why, in the Earth’s past, sea levels peaked at around 12–20 m higher than today during sustained periods when temperatures reached 2°. During the height of the Pliocene 3 million years ago, when temperatures were between 2–3° higher than pre-industrial, sea levels peaked at around 20–25 m.
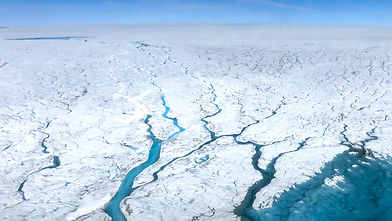
Fast-moving meltwater rivers flowing across the Greenland Ice Sheet. Image: Maria-José Viñas / NASA Earth Science News Team Science Source
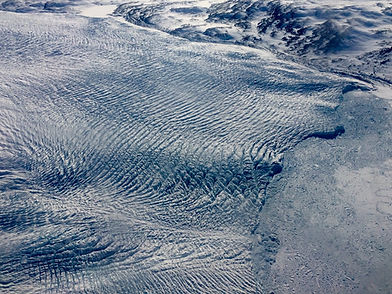
Outlet glacier on the Greenland Ice Sheet
Greenland Ice Sheet
Greenland will not reach a so-called tipping point until melting lowers its altitude, presumably over several centuries. The Greenland ice sheet is over 3000 m thick and above 3000 m altitude in the interior. If the height of this ice sheet is lowered through melting, it eventually becomes exposed to above-freezing temperatures for longer time periods throughout the year, leading to eventual unstoppable loss of the entire ice sheet.

WAIS and East Antarctica
The WAIS is a very different story: it does not really sit over land, but a vast archipelagoof islands similar to Indonesia today. Much of its ice therefore rests on bedrock that is actually below sea level, sloping downwards from the coast inland (Figure below).
This allows warming water to eat away at the ice from below, and it can rapidly become unstable, collapsing into the ocean and raising sea level.
This kind of instability is also true for some sectors of East Antarctica, for example the Wilkes Basin noted above; which might account for sea levels in the past higher than could have been caused by the loss of the WAIS (5 m), Greenland (7 m) and mountain glaciers (1–2 m) alone.
Cross-section of West Antarctica
Illlustration: Jonathan Bamber

Irreversible melt
The main question for scientists and policy makers is the rate of change, and at what point these higher sea levels become locked in. In general, scientists agree that higher temperatures, sustained for longer periods of time will result in both faster melt, and more rapid rates of sea level rise – as fast as several cm a year should temperatures exceed 4°, for example (today, sea level rise is measured in mm per year).
A key message for policy makers is that as the melt process accelerates, for significant sectors of the polar ice sheets it cannot be stopped or reversed until either temperatures go well below pre-industrial (initiation of a new Ice Age), or much of the ice sheet has flowed into the ocean. Practically speaking in other words, sea level rise is not reversible on human time scales.
Many scientists believe that this point of instability was already reached sometime before 2015 for parts of the WAIS and Antarctic Peninsula, when temperatures were around 0.8° above pre-industrial.
Even if this is the case, however, modeling shows that the inevitable collapse can be slowed substantially if we remain below 1.5°, allowing human communities and ecosystems centuries, rather than decades, to adapt to higher sea levels should temperatures climb far higher.
Committed Sea-level Rise from Antartctica at Different CO2 Emissions and Temperatures
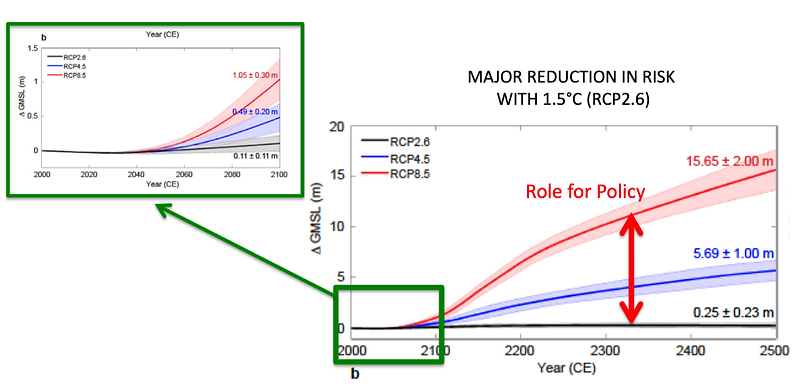
Over the long term, sea levels should rise very slowly if temperatures stay below 1.5°C (black bar, RCP2.6); but with high emissions (red bar, RCP8.5) sea levels are projected to rise exponentially for centuries, with 2100 only the beginning. Deconto and Pollard, 2016.
Unstable Ice Cliffs
A key uncertainty in this picture involves the degree of stability of the ice cliffs that will form as the floating ice shelves currently “holding back” the WAIS melt, leaving ice cliffs along the edges of the ice sheet that could be hundreds of meters high.
Eaten underneath by warmer water and broken apart by summer meltwater on the ice sheet surface, such ice cliffs would be inherently unstable and could collapse rapidly, potentially raising sea levels up to an additional meter within a century or two.
The risk of this more rapid sea level rise occurring becomes greater as temperatures pass 2°.
Sørsdal Glacier Photo: Kerry Steinberner
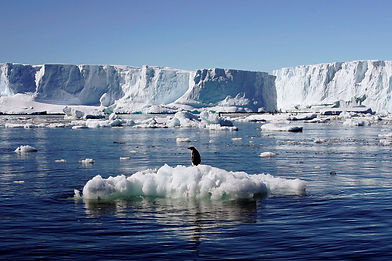
Melting ice on the coast of Adélie Land in East Antarctica. Image: Reuters / Pauline Askin
Benefits of 1.5°C
Regardless of the uncertainties surrounding the rate of future melt, we know that Greenland melt today is twice what it was 20 years ago; and three times higher from Antarctica. For a growing number of ice sheet experts therefore, the true “guardrail” to prevent dangerous levels and rates of sea-level rise is not 2° or even 1.5°, but 1°above pre-industrial.
For these scientists, a key argument in favor of a 1.5° limit is that it will allow us to return more quickly to the 1° level, drastically slowing global impacts from WAIS collapse especially, preserving the ability of low-lying communities to adapt through sustainable development, though sea levels will continue to rise for many centuries even after a return to lower temperatures.
Conversely, sea-level rise at rates of centimeters per year allows for neither adaption, nor development. The rate of future sea-level rise and associated risks to security and development depends entirely on future human emissions of greenhouse gases. To maintain the possibility of staying below 1.5°, such steps must be determined by 2020 and taken by 2030, in accordance with the IPCC SR1.5. Our human emissions will determine whether sea-level continues to rise on scales of millimeters, or centimeters per year and several meters in the long run; and thereby ruling whether impacts will be technically and economically manageable, or devastating and catastrophic.
Annual Flood Events on Vulnerable Coastlines – 2050
Improved satellite mapping shows more frequent and damaging flooding each year in many high-population areas by 2050.
Left: City of Tianjin near Beijing, Right: Bangladesh and Kolkata, India region.

Learn more:
IPCC Special Report: Global Warming of 1.5°C
IPCC Special Report on the Ocean and Cryosphere in a Changing Climate
ICCI The Cryosphere1.5° Report
References
Alley RB, Anandakrishnan S, Christianson K, Horgan HJ, Muto A, Parizek BR, Pollard D, Walker, RT (2015) Oceanic Forcing of Ice-Sheet Retreat: West Antarctica and More. Annual Review of Earth and Planetary Science 43: 207-231, doi:10.1146/annurev-earth-060614-105344
Applegate PJ, Parizek BR, Nicholas RE, Alley RB, Keller K (2014) Increasing temperature forcing reduces the Greenland Ice Sheet’s response time scale. Climate Dynamics, 45: 2001-2011, doi:10.1007/s00382-014-2451-7
Cook CP, Van De Flierdt T, Williams T, Hemming SR, Iwai M, Kobayashi M, Jimenez-Espejo F.J, Escutia C, González JJ, Khim BK, McKay RM, Passchier S, Bohaty SM, Riesselman CR, Tauxe L, Sugisaki S, Galindo AL, Patterson MO, Sangiorgi F, Pierce EL, Brinkhuis H, Klaus A, Fehr A, Bendle JAP, Bijl PK, Carr SA et al. (2013) Dynamic behavior of the East Antarctic ice sheet during Pliocene warmth. Nature Geoscience, 6: 765-769, doi:10.1038/ngeo1889
DeConto RM & Pollard D (2003) Rapid Cenozoic glaciation of Antarctica induced by declining atmospheric CO2. Nature, 421: 245-249, doi:10.1038/nature01290
DeConto RM & Pollard, D (2016) Contribution of Antarctica to past and future sea-level rise. Nature, 531: 591-597, doi:10.1038/nature17145
Dutton A, Carlson AE, Long AJ, Milne, GA, Clark P, DeConto, RM, et al. (2015) Sea-level rise due to polar ice-sheet mass loss during past warm periods. Science, 3491 (6244), doi:10.1126/ science.aaa4019
Etourneau L, Sgubin G, Crosta X, Swingedouw D, Willmott V, Barbara L, Houssais MN, Schouten S, Damste JSS, Goose H, Escutia C, Crespin J, Masse G, Kim JH (2019) Ocean temperature impact on ice shelf extent in the eastern Antarctic Peninsula. Nature Communications, 10: 304, doi:10.1038/ s41467-018-08195-6
Feldmann J & Levermann A (2015) Collapse of the West Antarctic Ice Sheet after local destabilization of the Amundsen Basin. Proceedings of the National Academy of Sciences, 112: 14191–14196, doi:10.1073/pnas.1512482112
Greenbaum JS, Blankenship DD, Young DA, Richter TG, Roberts JL, Aitken ARA, Legresy DM, Schroeder DM, Warner RC, van Ommen TD, Siegert MJ (2015) Ocean access to a cavity beneath Totten Glacier in East Antarctica. Nature Geoscience, 8: 294–298, doi:10.1038/ngeo2388
Joughin I, Smith BE, Medley B (2014) Marine ice sheet collapse potentially under way for the Thwaites Glacier Basin, West Antarctica. Science, 344: 735-738, doi:10.1126/ science.1249055
Marzeion B & Levermann A (2014) Loss of cultural world heritage and currently inhabited places to sea-level rise. Environmental Research Letters, 9: 034001, doi:10.1088/1748-9326/9/3/034001
Mengel M & Levermann A (2014) Ice plug prevents irreversible discharge from East Antarctica. Nature Climate Change, 4: 451-455, doi:10.1038/nclimate2226
Mouginot J, Rignot E, Scheuchl B, Fenty I, Khazendar A, Morlighem M, Buzzi A, Paden J (2015) Fast retreat of Zachariæ Isstrøm, northeast Greenland. Science, 350: 1357–1361, doi:10.1126/science.aac7111
Naish T, Powell R, Levy R, Wilson G, Scherer R, et al. (2009) Obliquity-paced Pliocene West Antarctic ice sheet oscillations. Nature, 458, doi:10.1038/nature07867
Pattyn F, Ritz C, Hanna E, Asay-Davis X, DeConto R, Durand G, et al. (2018) The Greenland and Antarctic ice sheets under 1.5°C global warming. Nature Climate Change, 8: 1053-1061, doi:10.1038/s41558-018-0305-8
Rignot E, Mouginot J, Morlighem M, Seroussi H, Scheuchl B (2014) Widespread, rapid grounding line retreat of Pine Island, Thwaites, Smith, and Kohler glaciers, West Antarctica, from 1992 to 2011. Geophysical Research Letters, 41: 3502-3509. doi:10.1002/2014GL060140
Rignot E, Mouginot J, Scheuchl B, van den Broeke M, van Wessem MJ, Morlighem M (2019) Four decades of Antarctic Ice Sheet mass balance from 1979–2017. PNAS, 116:1095-1103, doi:10.1073/pnas.1812883116
Robinson A, Calov R, Ganopolski A (2012) Multistability and critical thresholds of the Greenland ice sheet. Nature Climate Change, 2: 429-432, http://doi.org/10.1038/nclimate1449
Winkelmann R, Levermann A, Ridgewell A, Caldeira K (2015) Combustion of available fossil fuel resources sufficient to eliminate the Antarctic Ice Sheet. Science Advances, 1: e1500589. doi:10.1126/sciadv.1500589
Wouters B, Martin-Español A, Helm V, Flament T, Van Wessem JM, Ligtenberg SRM, Broeke MRVD, Bamber JL (2015) Dynamic thinning of glaciers on the Southern Antarctic Peninsula. Science, 348: 899-903, doi:10.1126/science.aaa5727